

Key Financial Metrics Every Startup Should Track
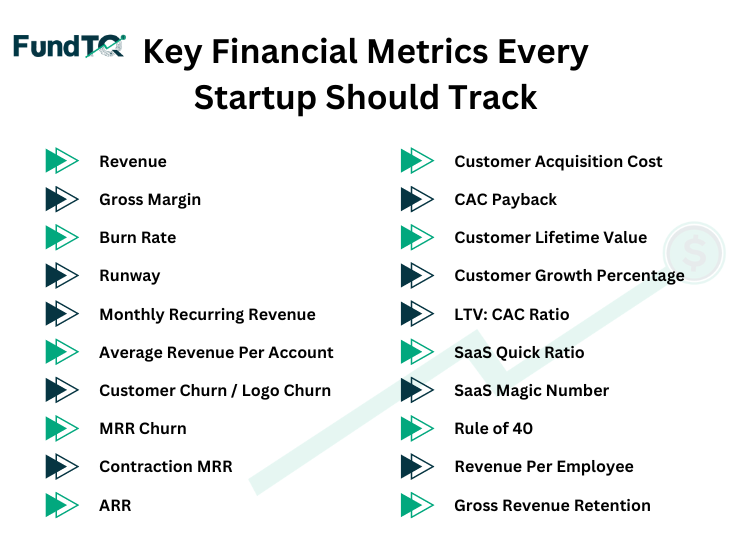
Financial metrics are essential for assessing the performance and health of any business. For any organization to be evaluated for health and success, financial measurements are critical. There are some of the key financial metrics that every business should manage and evaluate regularly, ranging from revenue and profitability to the expenses you pay to draw in new clients.
By keeping a close eye on these financial metrics, you can identify valuable insights into your business’s financial health, identify potential areas where you can make improvements, and make data-driven decisions that drive your business toward growth and success.
Though there are a ton of financial metrics that you can track, including the ones that are listed below, we recommend finding the KPIs that are the most important and relevant to your business based on your unique strategic goals.
Financial Key Metrics
Let’s dive right in. Here are some of the important financial metrics that your business can track.
1. Revenue
The total amount of money your business makes from the sale of its goods or services over a specific period is known as revenue or sales.
Formula
Price of Goods/Services * Quantity Sold
Why it’s Important?
- Any firm needs to be able to produce sales to function.
- Monitoring this indication over time will help you determine if your company is expanding, contracting, or declining.
- Even if revenue differs from the real profit your company makes, you may still learn a lot by analyzing the sales volumes of individual products and services and segmenting your revenue based on the types of income (recurring or non-recurring).
2. Gross Margin
The percentage of income your company keeps after deducting all costs associated with producing your good or service is known as its gross margin.
Formula
(Revenue – Cost of Goods Sold)/Revenue
Why it’s Important?
- One of the financial indicators that matters the most to investors is gross margin, which will show you how well you are allocating your resources.
- It’s a metric for profitability that shows you how much money your business makes for every dollar that is sold for products or services.
- A high gross margin indicates that you are making enough money on the inside to support potential future expansion. Additionally, if a company expands, its gross margin will often rise with time.
- However, a smaller margin can indicate that you need to raise the pricing of your good or service to better offset the expenses you pay to deliver it.
3. Burn Rate
The rate at which your business uses cash to fund operations is called its burn rate.
Formula
Cash payments – cash collections
Why it’s Important
- Your burn rate will show you how much money your business is “burning” over a given length of time.
- Your organization is using its cash more quickly the greater its burn rate.
- The sustainability of your operations may be significantly impacted by this, and a persistently high burn rate may indicate that you may require outside funding in order to maintain your company.
4. Runway
Runway (a.k.a cash runway) is how many months your business has before it runs out of cash.
Formula
Cash in Hand / Projected Burn Rate
Why it’s Important
- Your startup will have more time to develop and expand if its runway is longer.
- Your revenue and expenses define your runway. You will eventually run out of money if your monthly spending exceeds your monthly income. Your runway indicates when “eventually” will happen.
- This financial measure can provide you with a wealth of business insights, aside from the obvious—your firm physically needs a runway to stay in business.
5. Monthly Recurring Revenue (MRR)
The total amount of recurring money you receive from subscription clients each month is represented by monthly recurring revenue (MRR), a financial statistic used by SaaS companies.
Formula
Average Revenue per Account (Monthly) * Total # of Customers
Why it’s Important
- Based on the monthly cost you charge your clients, the monthly revenue ratio (MRR) provides subscription-based businesses with a reliable indicator of how much money they may expect to produce each month.
- When combined with other indicators that are significant to SaaS companies, such as potential growth, churn rate, and other variables, MRR can be a useful tool for projecting future monthly income and assisting with future decision-making.
6. Average Revenue Per Account (ARPA)
A SaaS company uses average revenue per account (ARPA) as a metric to calculate the average revenue per paying account.
Formula
MRR / # of Total Accounts
Why it’s Important
- With ARPA, you may get a more thorough understanding of your profitability and growth by objectively comparing yourself to others in the industry.
- Despite their similarities, average revenue per unit (ARPU) and this measure should not be confused.
- You can gain insights from ARPA on client retention, pricing strategy, and total revenue growth. Generally speaking, a rising ARPA indicates that your marketing and sales initiatives are paying off.
- You may identify monthly customer patterns, the goods that generate the most money, and the most popular subscription level among your customers by monitoring this metric over time.
7. Customer Churn / Logo Churn
Customer churn (a.k.a. customer attrition or logo churn) is the percentage of customers your business lost during a set period of time.
Formula
(# of Churned Customers / Total # of Customers at the Beginning of the Period) * 100
Why it’s Important
- Every SaaS company will eventually lose clients, so you should ensure you’re maximizing your churn rate and gaining more clients than you lose over a specific time frame.
- Your long-term business performance will benefit from a lower churn rate, achieved by retaining a larger customer base.
- Higher churn rates make it more difficult for you to expand your clientele because you will always need to find new ones to replace the departing ones before you can concentrate on expansion.
8. MRR Churn
The amount of monthly recurring revenue (MRR) that you lose from current clients is known as MRR churn.
Formula
Customers at the Beginning of the Month * Churn Rate * ARPA
Why it’s Important
- Knowing your MRR churn is just as crucial for SaaS companies as knowing what their MRR is.
- Once more, some level of churn is unavoidable for your company, but to make wise judgments, you must be well-informed about it.
- When taking into account lost clients, MRR churn can be utilized to anticipate monthly revenue increases over time, which can aid in your financial planning efforts. Additionally, this will improve your visibility on your financial runway.
9. Contraction MRR
The amount of predictable money your business will receive from clients each year is known as annual recurring revenue.
Formula
Downgrade MRR + Churn MRR
Why it’s Important
- Even though it’s unavoidable, customers will downgrade or cancel subscriptions each month, therefore it’s critical to track and optimize this measure.
- Understanding your contraction margin ratio (CRR) is important, but you can go deeper into the data to gain additional insights into things like whether your product is overpriced in the market, whether you’re not providing enough value, or whether you’re not communicating the value you offer well enough.
- Naturally, you would rather a client downgrade than cancel entirely, so be sure to identify the factors influencing your contraction MRR so you can quickly resolve any problems and further your growth goals.
10. ARR
Annual recurring revenue is the amount of predictable revenue your company will generate from customers in a year.
Formula
MRR * 12
Why it’s Important
- If your company is subscription-based, you can benefit greatly from using ARR, the annualized form of MRR.
- Your firm will dry up if you can’t rely on your subscribing clients to provide a steady stream of predictable revenue every year.
- As a result, keeping an eye on your annual revenue ratio (ARR) over time will enable you to make well-informed budgetary decisions, guarantee that your firm is growing, and generate realistic revenue projections.
Get financial advice from industry experts
11. Customer Acquisition Cost (CAC)
The customer acquisition cost (CAC) represents the amount of money your business must pay to acquire a new client.
Formula
Sales & Marketing Expenses / # of New Customers Acquired
Why it’s Important
- It is incredibly helpful to know how much money your firm needs to spend on attracting new customers.
- Your CAC will tell you how successful your marketing and sales activities are as well as how much money you need to spend on marketing to close a new customer.
- The marketing department’s responsibility to optimize your customer acquisition cost (CAC) is crucial since underspending on client acquisition might hinder your ability to grow while overspending on the acquisition can prevent you from turning a profit.
12. CAC Payback
The term “CAC payback,” also known as “months to recover CAC,” describes how long it will take your company to recoup the costs associated with acquiring new customers.
Formula
Sales & Marketing Expenses / (New MRR * Gross Margin)
Why it’s Important
- The shorter the CAC payback period, the faster you’ll be ‘breaking even’ on your client acquisition costs and recuperating your investment.
- You can determine the kind of return on investment (ROI) and overall effectiveness of your sales and marketing campaigns by knowing your CAC payback.
- It is crucial to evaluate your CAC payback duration in conjunction with other financial indicators, such as your LTV, since a low LTV and a lengthy CAC payback period may render you bankrupt if new clients leave before you have recovered all of your client acquisition expenses.
13. Customer Lifetime Value (CLV)
The customer lifetime value (CLV) represents the average revenue you can expect to receive from a customer before they leave.
Formula
(ARPA * Gross Margin) / Churn Rate
Why it’s Important
- Since your consumers are the lifeblood of your company, your lifetime value (LTV) shows how much each new client is worth in the long run.
- Your LTV may tell you several things about your clients, such as how long they remain loyal to you and how much they value your goods.
- Because you want to keep consumers satisfied for as long as possible and raise the amount of money they spend with you, enhancing this financial indicator requires multiple approaches.
14. Customer Growth Percentage
Customer growth percentage, or new logo growth, measures the proportion of new customers acquired during the current period relative to the total number of customers from the previous period.
Formula
((New Customer this Period – New Customers Last Period) / New Customers Last Period) * 100
Why it’s Important
- This is a crucial sign of your capacity to grow your clientele and increase your market share.
- If your organization is a software as a service (SaaS) provider, which usually depends on customer acquisition for business growth, then customer growth % is an excellent KPI to track.
- A strong new customer growth rate usually means that your marketing and sales activities are working to help you expand your business and attract new clients.
- But, you should also evaluate other metrics like customer churn rates, client lifetime value, and more to get a full insight into your business’s customer acquisition strategy.
15. LTV: CAC Ratio
The LTV: CAC ratio displays the relationship between your client lifetime value and your customer acquisition expenses.
Formula
Customer Lifetime Value / Customer Acquisition Cost
Why it’s Important
- By comparing LTV and CAC, you may determine whether you’re paying too much or not enough on client acquisition, depending on whether the CAC is higher than the LTV.
- While gaining new clients is expensive, you must balance the LTV and CAC correctly to make sure your marketing initiatives will benefit your company in the long run.
16. SaaS Quick Ratio
The SaaS fast ratio measures the proportion of MRR gained through new business and expansion compared to that lost through churn and contraction.
Formula
(New MRR + Expansion MRR) / (Churn MRR + Contraction MRR)
Why it’s Important
- Growing MRR may seem like a generally positive indicator, but to make sure it’s sustainable, you need to take into account both the growth and the amount of MRR you’re losing each month to churn and contraction.
- Startups often regard a decent SaaS fast ratio as 4, but you should also consider the other financial indicators to get a more complete picture of your company’s health.
17. SaaS Magic Number
The SaaS magic number compares the growth in revenue of your business to the costs associated with acquiring new customers.
Formula
(New MRR + Expansion MRR) / (Contraction MRR + Churned MRR)
Why it’s Important
- You may find out whether you’re overspending on client acquisition and how much revenue growth you produce for each dollar spent on sales and marketing by using your SaaS magic number.
- A high magic number indicates to potential investors that your organization can grow its income significantly while spending less on sales and marketing, which is a positive indication for the long-term viability of your enterprise.
18. Rule of 40
The Rule of 40 assesses how well your company performs when it comes to profitability and growth in recurring revenue.
Formula
Revenue Growth Rate + Gross Margin
Why it’s Important
- Many investors will use this straightforward guideline to assess the financial stability of your company, especially if it offers software as a service.
- When your company’s growth rate plus profitability are at or above 40, the statistic indicates “good” performance. This indicates that your business is making profits and expanding at a healthy rate, which is often encouraging to investors.
- Should the total of these two figures be less than 40, it may suggest that your business is expanding rapidly while maintaining poor profitability, or expanding profitably but at a sluggish pace.
- It’s crucial to remember that although the Rule of 40 may not be a complete indicator of your company’s financial health, investors may rely on it as a quick benchmark value.
19. Revenue Per Employee
The money generated by each employee for your company is displayed as revenue per employee.
Formula
TTM Total Company Revenue / Current # of Full-Time Employees
Why it’s Important
- Although your staff is essential to your organization, they also come at a significant cost.
- Although you might not use revenue per employee as your only indicator when making critical business decisions, it does provide you with an objective means of gauging your team’s productivity.
- By integrating additional significant financial data and evaluating it against industry standards, you may plan for future expansion and make sure that the output of your staff will help you reach these goals.
20. Gross Revenue Retention
The percentage of your revenue that is kept over a specific period is known as gross revenue retention.
Formula
1 – [(Churned MRR + Downgrade MRR) / MRR at the End of the Previous Month]
Why it’s Important
- Keeping an eye on your gross revenue retention is essential for any expanding SaaS company looking to gauge how satisfied your clients are with your offerings.
- Your gross revenue retention rate should rise over time as a reflection of your commitment to your clients and a strong product/market fit.
- You may obtain a strong understanding of your profitability by evaluating your revenue retention rate in conjunction with other financial indicators such as LTV and CAC. A greater revenue retention rate indicates that you are sustaining sales with the clients you have previously paid to acquire.